[home] [lebenslauf] [universität] [bilderbuch] [indifferent]
Indifferent - Nightreports - Nightreport 1
Date:11.04.1999
Subject: Sleep and Dreams
Welcome
This e-mail is coming directly from the sleeping lab
at Stanford. Supervisor is no
one else than Dr. Stephen LaBerge. I'm glad to make my first
Night-Report and take this occasion to explain some of those things,
which are going on when I spend my nights here in Stanford.
Basically there is a team from about six people around the Lucidity
Institute (The Lucidity Institute is Stephen LaBerges company
where you can buy devices to induce lucid dreams). There are Stephen,
Keith, Nathen, Mark, Frank and myself. But during the night recordings
there are only three to four people. One is the dreamer, up to now Nathen was the one and only
- and he is pretty successful in having lucid dreams. Than, there is
Mark, he is the right hand
from Stephen and he introduced me to the most things here in Stanford.
Mark also showed me the application technique for EEG, EMG and EOG electrodes at the
subject. Finally Stephen, he is the supervisor, double-checks everything and
tries to answer all our questions.
After everybody is here, lets' say around 7:00pm, we start with the
application of the electrodes. This procedure takes about 2 hours (but
we're getting better!). There are 38 electrodes to stick on the head
of the subject. After we fixed them properly we have to do several
checks if everything is okay. Last time we had problems with the
electrodes and it took us about 3 hours to fix these mistakes. After
everything is done we send our subject to bed and we go to the next
room with the computer. Nathen, the subject, lies in an about 2 to 2
to 1 meter big black soundproofed box - the booth. We have speak-contact and we
also can watch him per video. Finally, we see his
recordings on the screen and that's the most exciting part. Before we
allow him to sleep, there are some more tests for calibration. There
is also a special task that Nathen has to do with his eyes. It is a
combination of eye-movements. These eye-movements are the same task,
which he tries to do later in his dreams.
Anyway, now it's time to
sleep and we can watch all of this on the monitor. What do we see on
the screen? We see 32 lines, each line represent one electrode on
Nathens head. There is the Electroencephalogram (EEG), which shows us
electrical potentials from the brain, the Electrooculogram (EOG),
which shows us electrical potential from the eyes (refers to
eyemovement) and finally the electromyograph (EMG), which shows us
electrical potential from the muscles at the chin (See figure 1).
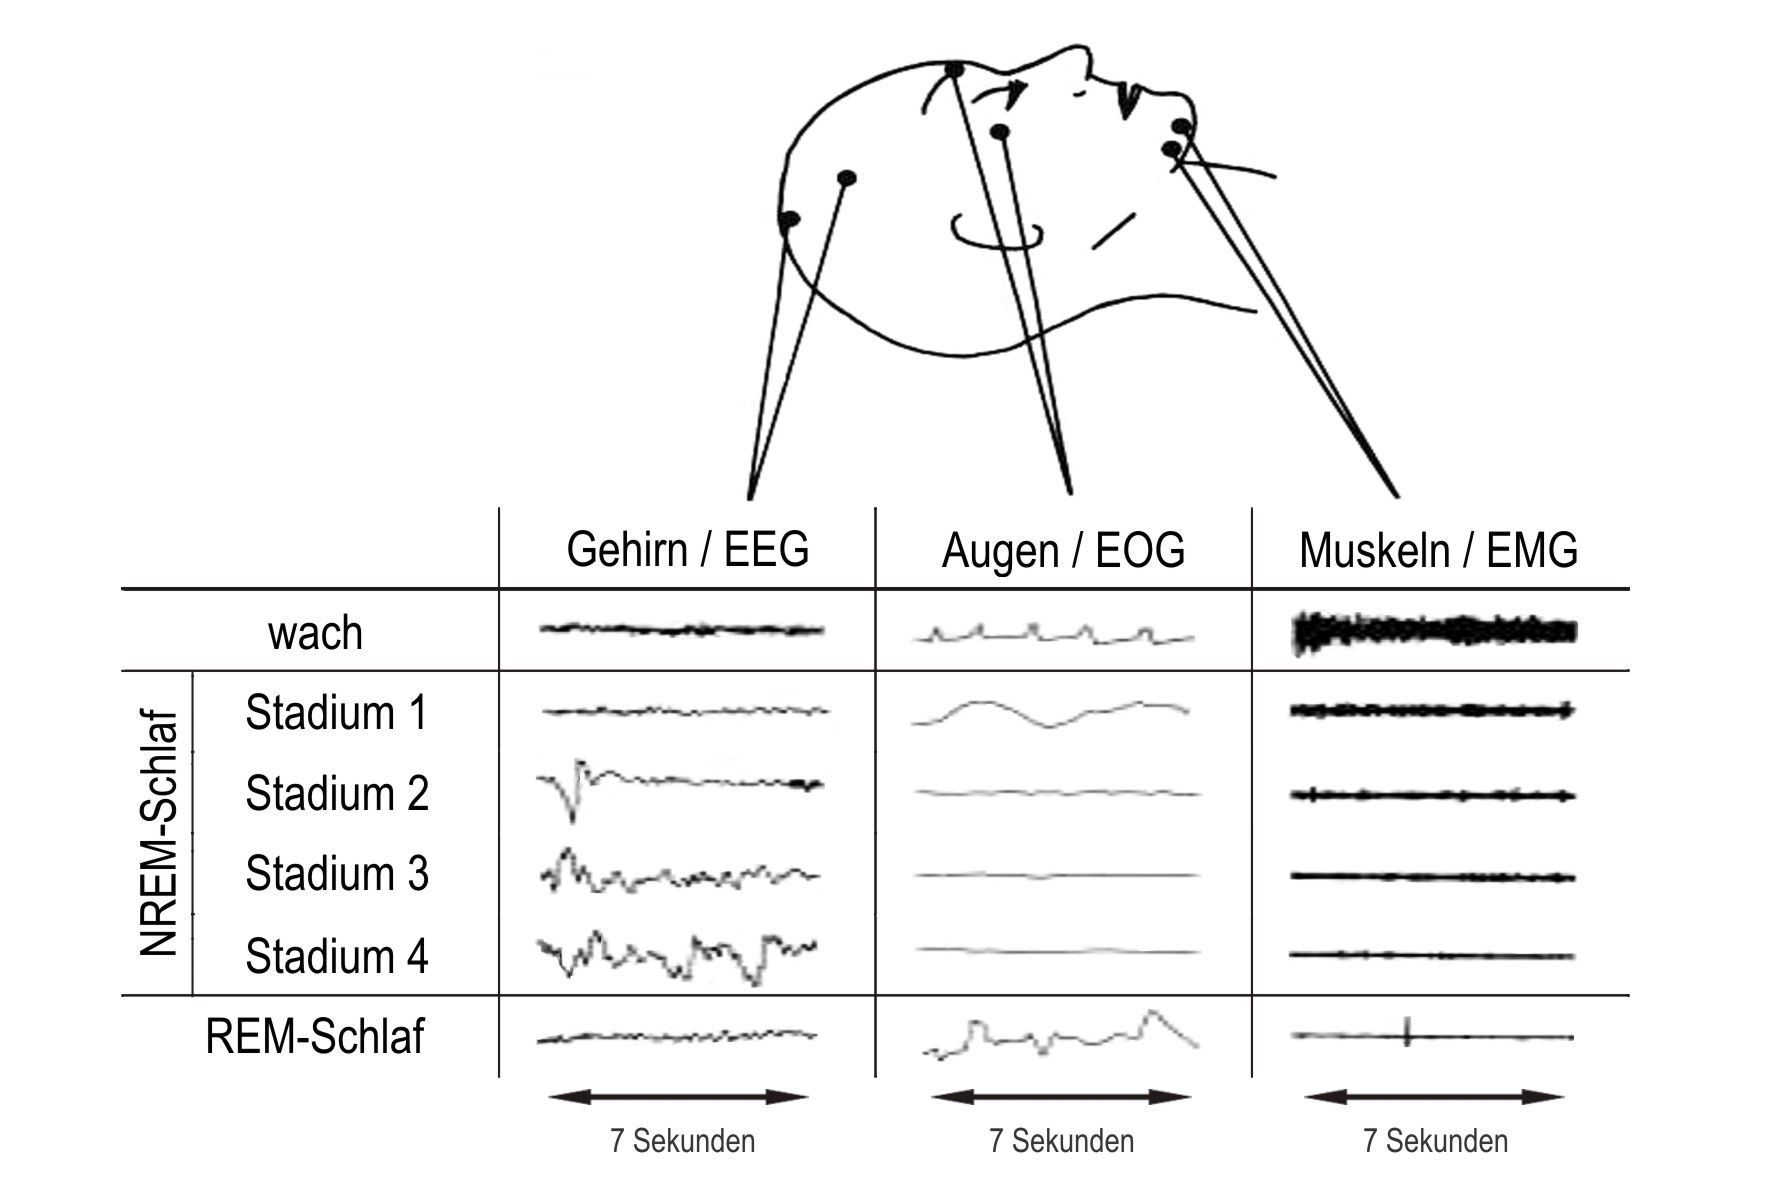
Figure 1. Placement of electrodes and sleep stages (from Borbķly, 1998).
Sleep Stages
For what those measurements? These three measures are indicators for
different sleep stages. All in all there are five different
sleep-stages. All these stages differ in the curves from the EEG, EOG
and EMG. When we fall asleep we can observe sleep stage 1. The EEG
shows alpha-waves and the eyes start to roll slowly. Where exactly the
sleep-onset is, is hard to tell. Ten people would say something
totally different. Per definition the sleep-onset is when the person
who falls asleep actively suppresses the perception of the external world. An example should
clarify this point, if we take someone who is pretty tired and we would place
him in front of a big light and we would turn on the light every 15
sec for 2 sec. Than we would ask this person to push a button every
time when he sees the light. Per definition, this person would sleep
when he is no longer able to push the button, but the light is on.
Would we ask him afterwards if he saw the light, he would answer
"No, the light was off".
The next stage is sleep-stage 2, which is a transition stage to
the slow-wave sleep, or deep sleep. Some researcher refer this stage
as sleep onset. The EEG shows now low frequented waves with low
amplitude and from time to time we can observe K-complexes and sleep
spindles. A K-complex is a single high amplitude (spike) and spindles
are high-frequented waves with low amplitude. The sleep is getting
deeper and we reach sleep-stage 3 and 4. Stage 3 and 4 are the same, differ
only in the percentage of overall delta waves. Delta
waves are low frequented waves with high amplitude. Now we are in
the deep sleep (See figure 2).
Figure 2. Normal EEG Rhythms (from Davila,
1997).
REM-sleep and dreaming
And now? After we went through all those stages we start to dream. Dreams are highly correlated with the REM-stage (Rapid Eye Movement), this means if we wake people up from a REM-stage, 80% of the people would probably remember a dream. What are the indicators for REM-stage?
-
The EEG resembles the brainwaves from wakefulness
-
We can see bursts of rapid eye movements
-
The body is paralyzed (observable in the EMG measure).
That our body is paralyzed is good, because this prevents us that we do not act our dreams in the real world. After the REM-stage the whole cycle starts from the beginning up to six times per night. If we have a normal person in the lab his sleep profile would look like figure 3.
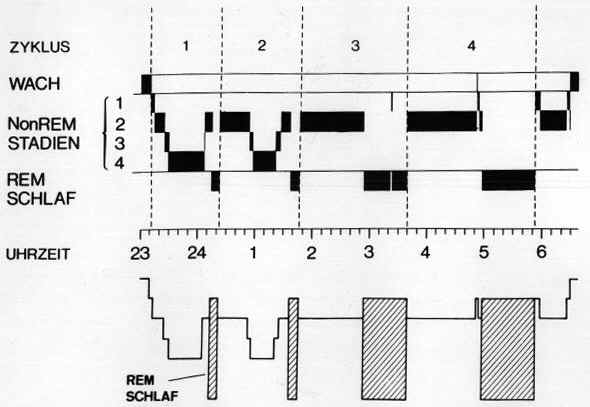
Figure 3. Sleep cycles during the night (from Borbķly, 1998)
Electroencephalogram (EEG)
The electroencephalogram (EEG) is a time-varying electrical signal recorded from electrodes attached to the scalp of a human subject. The signal arises from action potentials - short-lasting changes in potential difference - within the neural cells of the brain and, as such, are a measure of brain activity. Identifiable features of the EEG can be used to differentiate between the brain states of the patient, for example, during sleep, quiet wakefulness, etc. Any recording system for the EEG requires the following components:
-
Electrodes attached to the scalp of the subject.
-
Amplifiers to boost the electrical signals from the scalp. The amplitude of the input signals from the electrodes is usually in the range 10-100mV and high input impedance differential amplifiers are used to boost this level.
-
Filters to filter the EEG signal before recording. High-pass, low-pass and notch filters are all used in this context. DC recordings refer to recordings without filtering.
-
Recording unit which is used to keep a permanent record of the EEG signal. Originally the EEG was recorded on paper but digital recording is becoming more usual.
A number of different configurations have been proposed for electrode placement but the 10-20 International System is now the most common layout in use. The electrode positions and labels for the 10-20 system are shown in the figure 4.
Figure 4. The ten-twenty electrode system (from Garskadon, 1980)
Reference
Borbķly, A. (1998). Das Geheimnis des Schlafs. Neue Wege und Erkenntnisse der Forschung [Electronic version]. (Original work published 1984. Stuttgart: DVA.). Retrieved May 23, 2001, from http://www.unizh.ch/phar/sleep/buch/TITEL.htm
Davila, C. E. (1997/Administrator). Normal EEG Rhythms. Retrieved October 25, 1999, from http://www.seas.smu.edu/~cd/EE5340/lect11/sld018.htm
Garskadon, M. A. (1980). A manual for polysomnography (PSG) technicians. Unpublished manual: Stanford University.
[13. Juli 2004] [kontakt]